|
NASA: The chill of solar minimum is being felt in our atmosphere – cooling trend seen Global warming was always driven by the sun. Human involvement is de minimus at best. But because there was a correlation between some human activities and an increase in temperature, the environmentally religious working in climate sciences realized that they could use this increase in temperature to accomplish their long-term goals. It was a scam from the beginning. Or a religious crusade, but then what is the difference?! One chart shows what happened and why it so fooled the cultish climate scientists. 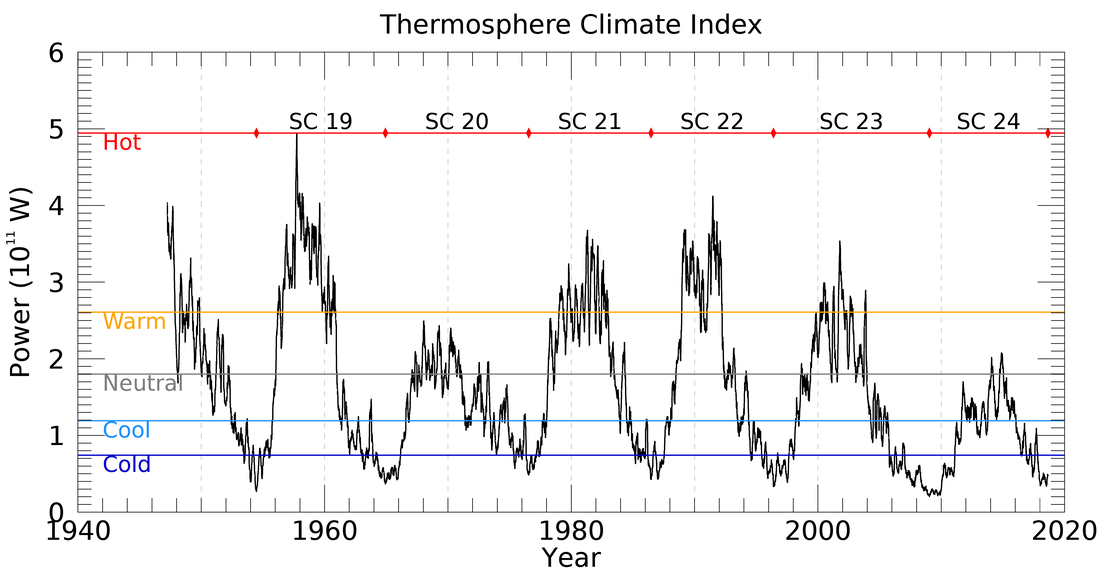 Below is a graph of the HADCrut3 global temperature anomaly. Notice that the temperature before 1910 is stable, this is because the earth in the throes of the Little Ice Age and is very cold, the deepest, longest, coldest temperatures during the Holocene. From 1910, the temperature begins to rise pointing to the fact that the Little Ice Age has ended and the earth is moving back towards more normal temperatures. This brief warming trend is replaced in the late 1940s with a cooling trend which lasts until the late 1970s. It is replaced with a warming trend to the mid 1990s. That trend is followed by a flat trend to the present. The climate data and the solar data align nicely and the solar explains what is happening nicely. The climate alarmist carbon data does not align with the climate data at all, and does not explain what is happening.  According to the global warming cultists themselves, global warming began in 1978 and runs to the present. The period from the early 1950s to 1978 was a time of declining earth temperature, and the amount of carbon being produced then was insufficient to cause global warming. But look at the graph above to see the real cause of the pre-1978 cooling trend, the 1978-1998 warming trend, and the current, post-1998, cooling trend. From the mid-1950s there is a clear cooling trend. This resulted in the fear-mongering in the mid-1970s of a new ice age. From 1978, there is a clear warming trend which peaks in the mid-1990s. From the mid-1990s, there is a clear cooling trend. This matches the earth's climate data well. The global alarmist's data is that man has been dumping carbon into the atmosphere since the 1950s in amounts which make it the primary driver of global temperature. If true, this requires that the global temperature will continually rise. It does not. The temperature initially falls until 1978, then for 20 years (1978 to 1998) it rises, and then it falls again. The climate alarmists have never explained why if carbon is the driver of climate that the human-driven rise in atmospheric carbon from 7,000 bc to the present did not cause the earth's temperatures to rise. The chart below shows both carbon and earth temperature based on the only worldwide proxy data reconstruction of temperature (Marcott). Under their theory, this should have happened, but did not. However, the solar theory can account for most if not all of these changes in earth's temperature. 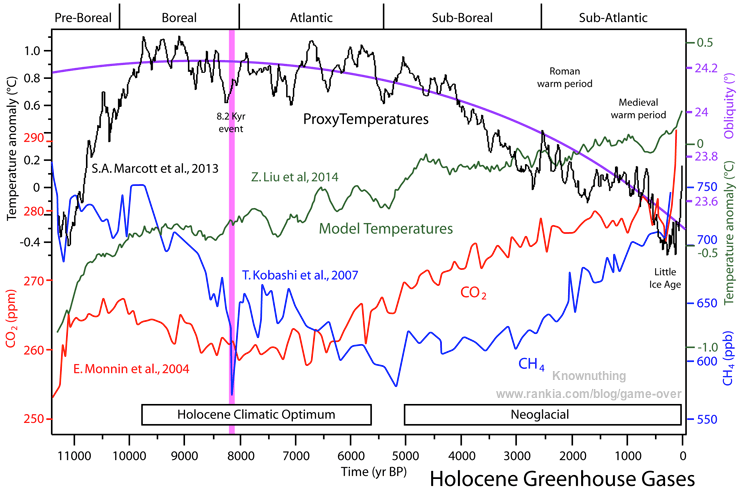 Unfortunately, we do not have enough data, either terrestrial or solar, to understand climate accurately. The global climate alarmists want you to believe otherwise but their inability to forecast climate or temperature even for a few years confirms this fact. Their models are so wildly inaccurate as to be no better and no less funny than a Monty Python skit.
Climate Change, due to Solar Variability or Greenhouse Gases? Part A. Climate Change, due to Solar Variability or Greenhouse Gases? Part B. We need more data.
Comments
|
AuthorMaddog Categories
All
|
 RSS Feed