|
The wrong term is global warming, the correct term apparently is climate change. Although I suspect that climate change is the wrong term by now and the climate sillybillies are on to a new tag already. The phrase climate change is a redundancy. It has never been about the change; it is about causation. 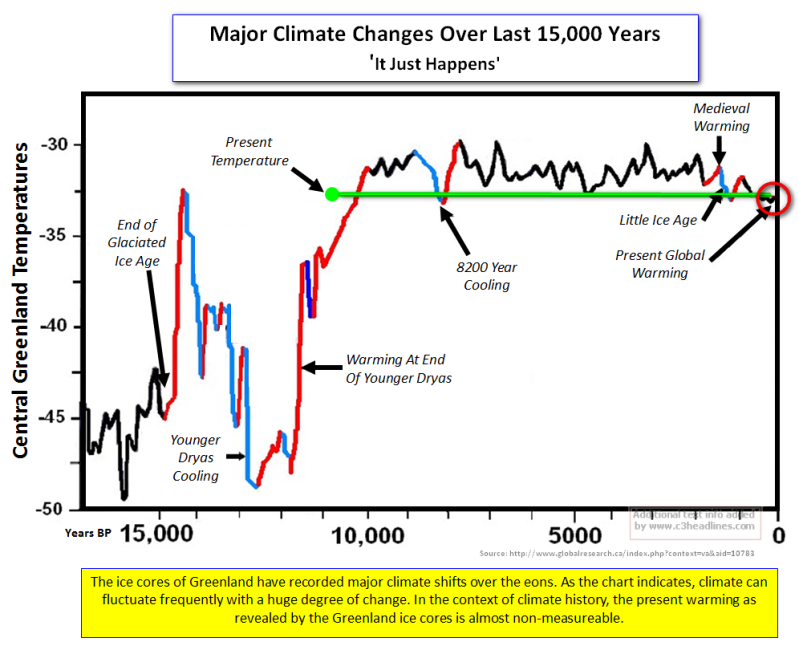 We just came out of the Little Ice Age, the coldest period during the entire Holocene, and these scientists want to tell me that the problem is that carbon is building up in the atmosphere and will cause climate change? Remember carbon building up in the atmosphere has a specific effect not a vague change in climate, but heating of the climate. Yes, the more intelligent of them go to great lengths to create clever but silly arguments as to why the heat will cause the climate to cool, but this is all blather and nonsense based on unscientific conjecture and fantasy. I will blow the graph up a bit for you. Because shrinking the data points is the trick necessary to make the climate NothingBurger into a climate catastrophe! 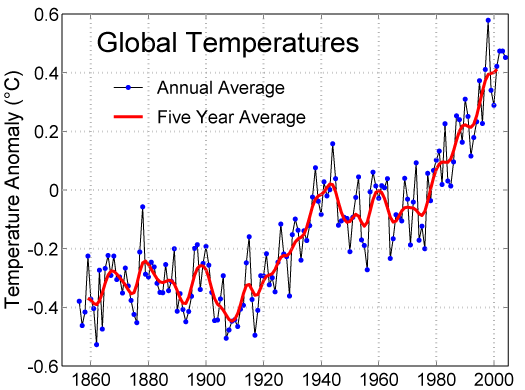 See, how appropriately scary that graph appears! We will soon be afire! Umm, no. We were in the depths of the Little Ice Age 250 to 350 years ago. The Little Ice Age was the longest cold period during the Holocene. Thankfully, the earth decided to snap out of it and is now trying mightily to return to the Holocene average. Realistically, the 0 line should be the Holocene Climate Optimum average not some fictitious zero point placed on a graph. But then the climate would still be rising towards zero and that is not alarming at all. I'll show you another image to make the point even clearer: 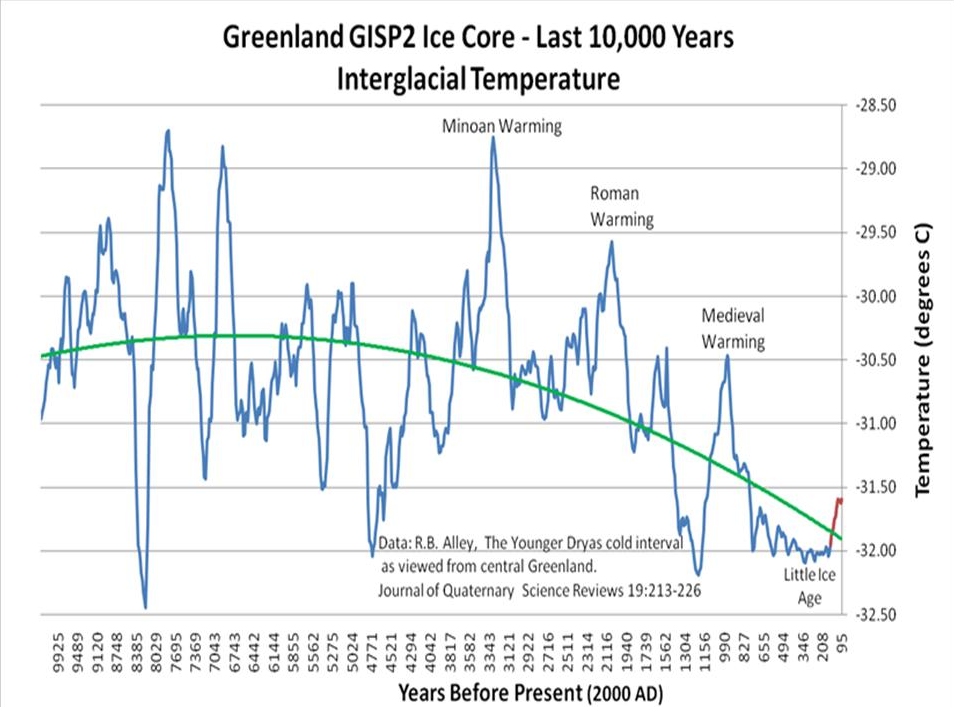 The red is current catastrophic global-climate-alarm holy grail. It is mere piffle. There are many times the earth shifted temperature far more than the tiny little red tail. The Holocene Climate Variability I have an entire series on climate at maddogslair.com. Use the search function - keyword - Holocene. Below is the only worldwide global climate reconstruction of the proxy data. Notice how it confirms that the present temperature is far below the Holocene climate optimum which is the Boreal, and Atlantic sections. Also, you should recognize that appending the current thermometer data to the proxy chart as done here is highly problematic and erroneous. That said, it is the best we can do. The article is excellent, I recommend it to you 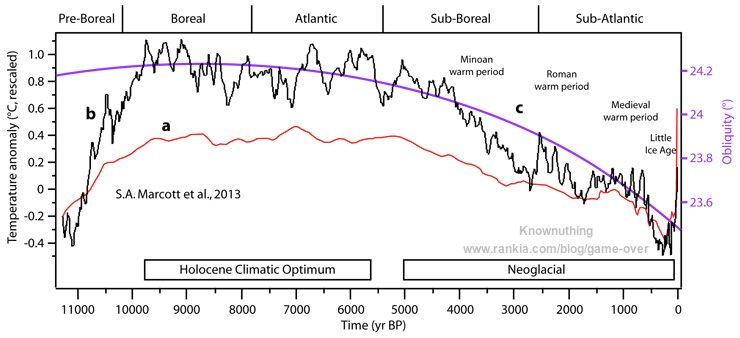 "Figure 37. Holocene global temperature change reconstruction. a. Red curve, global average temperature reconstruction from Marcott et al., 2013, figure 1. The averaging method does not correct for proxy drop out which produces an artificially enhanced terminal spike, while the Monte Carlo smoothing eliminates most variability information. b. Black curve, global average temperature reconstruction from Marcott et al., 2013, using proxy published dates, and differencing average. Temperature anomaly was rescaled to match biological, glaciological, and marine sedimentary evidence, indicating the Holocene Climate Optimum was about 1.2°C warmer than LIA. c. Purple curve, Earth’s axis obliquity is shown to display a similar trend to Holocene temperatures. Source: Marcott et al., 2013." What we need is to forget the climate modeling calculations. Models are not science, they are not even scientific nor do they have a place in the scientific method. They can be useful but not as the climate fraudsters are using them, as a cudgel. They can help scientists understand whether they are accurately or inaccurately understanding climate. If the models are far off from reality, the understanding is poor. The greater the time interval, the closer the model to reality the better we can consider the understanding of the science. The current models are not even in the ballpark. They are absurdly wild and do not track reality at all. Notice in the graph below that the total climate increase from 1983 is a paltry 0.4˚. The total period for global warming is 1978 to 1998. Before 1978 the earth had been in a slight cooling phase since before WWII. Since 1998 the climate has leveled off. The HadCRUT, NASA, and NOAA scientists agree with that analysis. 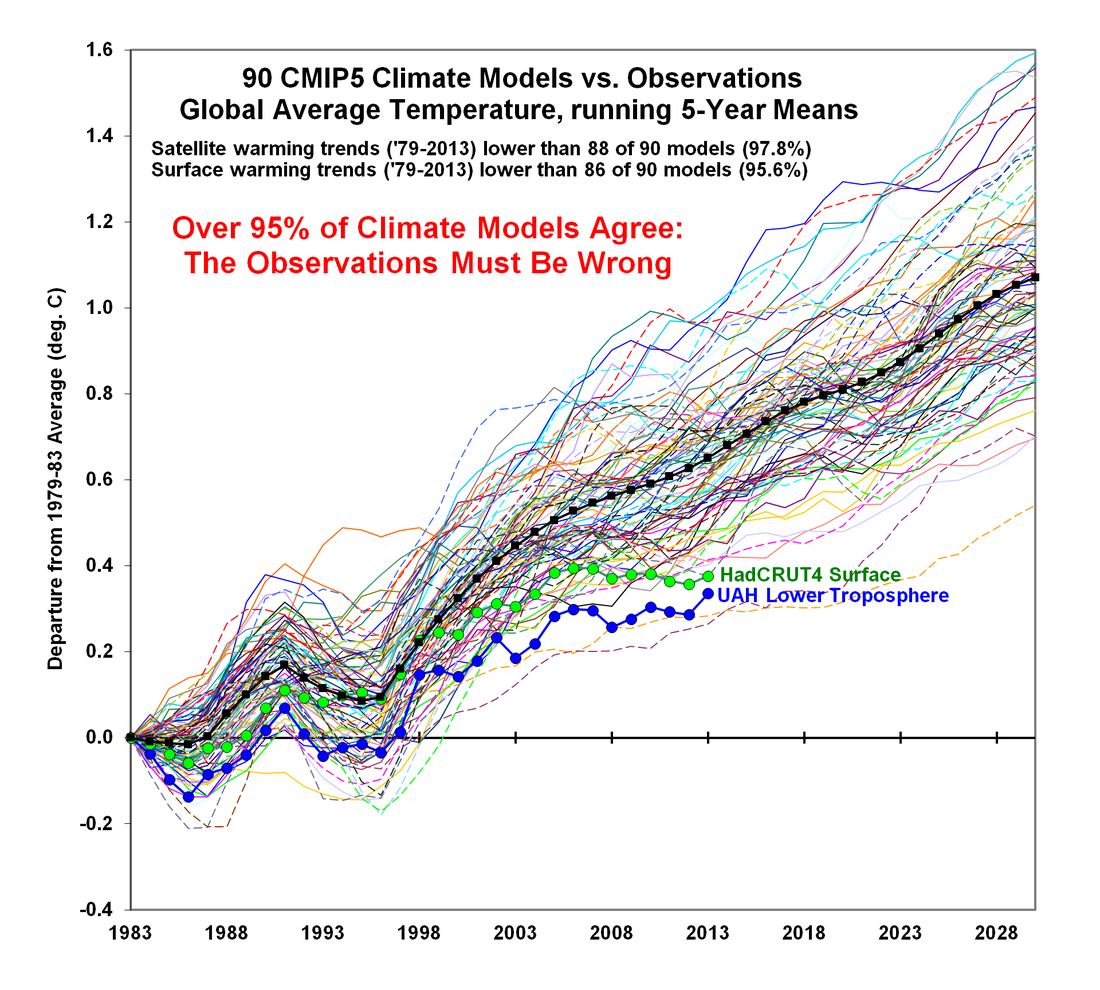 HadCRUT4 is one of the terrestrial based climate aggregators, UAH is the University of Alabama Huntsville which references the satellite data. Notice how the satellite data is lower than the human aggregated data. This is in part caused by the fact that the human data does not collect data from the 72% of the earth covered in water. The difference is also in part because the climate scientists at NOAA have been subtracting temperature from the older thermometer data while adding temperature to the newer data. How much? This much: 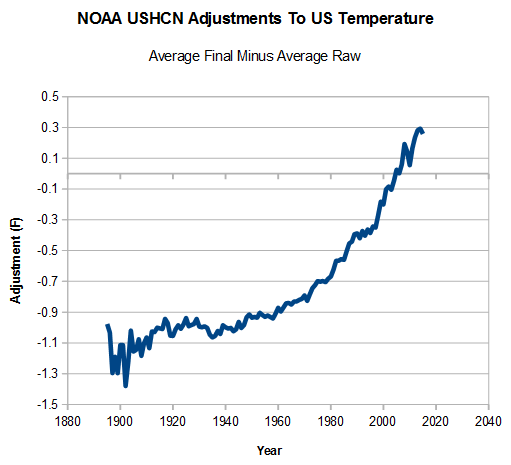 Just to be fair, that is more than the entire amount of global climate-change-warming-alarmism (whatever the nomenclature is now) during the entire period of potential global warming 1950 to present. Yes indeedy do, they have fudged the temperature increase more than the actual temperature "increase." So, in the US does that mean we've cooled? I don't know. No one knows because the data as published is worthless. To be fair, NOAA has not published reasons for taking these actions, so perhaps they have valid reasons. The problem is many scientists have been asking for those reasons for quite a while without a response from NOAA. That does not instill confidence.
I am not about to hop on the new Piltdown Man wagon just because all of the cool kids are doing it. I don't even like the cool kids. So, I will await them at the end of the ride with opprobrium and ridicule. Ok, not so much opprobrium or ridicule I will have forgotten the whole thing a fortnight after the collapse, because the cool kids will undoubtedly be on to the next bit of nonsense in need of debunking.
Comments
|
AuthorMaddog Categories
All
|
 RSS Feed