|
The Holocene and how it undermines climate fear mongers Take a quick look at the original article. One of the weaknesses to the article is that it relies on only a few temperature reconstructions. The new material adds the global temperature reconstruction by Marcott et al., 2013. Below are a few important sections brought forward, the update will appear later in the article: A Warm Period by Any Other Name – The Climatic Optimum Catastrophic anthropogenic global warming (CAGW) relies upon tiny data sets to work. If the data is expanded beyond about 120 years the argument quickly fails. More below. "Even a cursory examination of the Holocene shows why the period is problematic for promoters of anthropogenic global warming (AGW). As Steve McIntyre pointed out, the problems began when skeptics noted that the temperature for most of the Holocene contradicted their claim that the latter part of the 20th century was the warmest ever. I know they never used the term ‘ever’, rather, it was left unsaid but implied in the message to the public and not contradicted when used by the media. McIntyre wrote; The Team has taken a preditable (sic) position on the Holocene Optimum: that it’s a regional and restricted event." Or as the old adage goes, damn the torpedoes, obfuscate, obfuscate, obfuscate! OK, maybe I made that up. But by extending the data sets to 10,000 to 15,000 years, the data becomes much clearer. 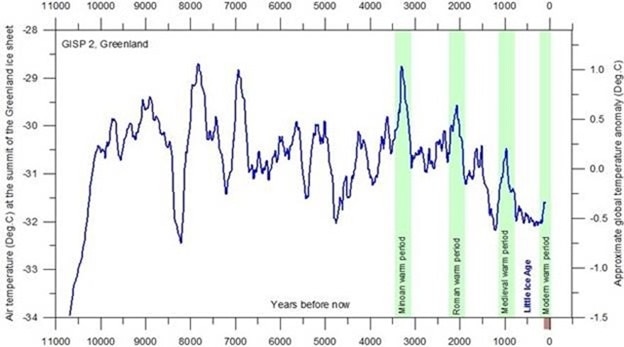 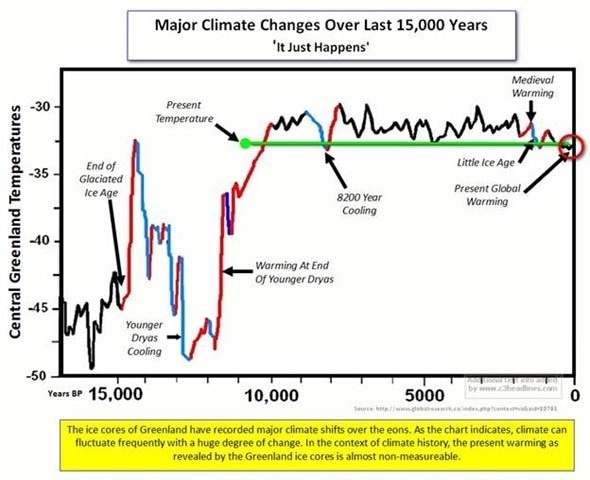 The first chart shows the great temperature rise as the earth came out of the last ice age, the high average temperature lasting from about 10,000 years ago to about 3,500 years ago, and then the consistent decline in average temperature to the present. It also shows that the Little Ice Age was one of the three coldest periods during the Holocene. The second chart shows the current temperature line as far below the Holocene temperature average, and on par with only a few Holocene cold periods. "Current temperatures are proclaimed as the warmest on record. In fact, the world was warmer than today for 97 percent of the last 10,000 years." This creates an obvious problem for the CAGW crowd. We are warming because just a hundred years ago, or so we were at one of the coldest periods in the Holocene. To proclaim this warming as terrifying, or out of control is irresponsible, and deeply foolish. So, how did the CAGW crowd create this fear out of whole cloth? They use a short data set which only encompasses the years 1850 to present, and then they fear monger. Update: Nature Unbound III: Holocene climate variability (Part A) "There is only one Holocene global average temperature reconstruction available (Marcott et al., 2013; figure 37 a). To correct some of the problems it presents, I use this reconstruction averaged by differencing (explained here), without any smoothing, and with the original published dates for the proxies. I have also rescaled the temperature changes to make them congruent with the vast literature and consilience of evidence from different fields that indicates that the Holocene Climatic Optimum was on average between 1 and 2 °C warmer than the Little Ice Age (figure 37 b). This rescaling is discussed below. The resulting temperature curve is extraordinarily similar to H. Lamb reconstruction from the 1970s (figure 36 A), with significant temperature drops at 5.5, 3, and 0.5 kyr BP." 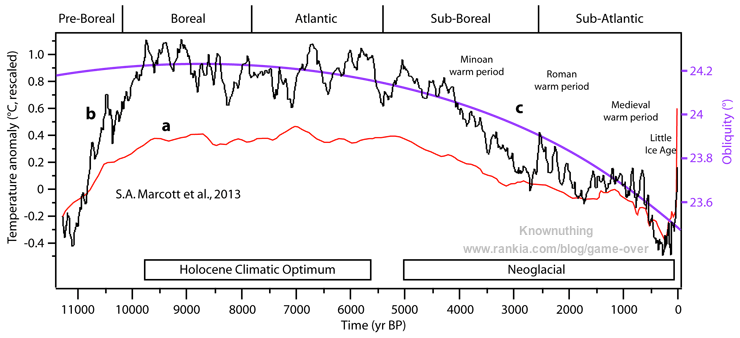 "Red curve, global average temperature reconstruction from Marcott et al., 2013, figure 1. The averaging method does not correct for proxy drop out which produces an artificially enhanced terminal spike, while the Monte Carlo smoothing eliminates most variability information. b. Black curve, global average temperature reconstruction from Marcott et al., 2013, using proxy published dates, and differencing average. Temperature anomaly was rescaled to match biological, glaciological, and marine sedimentary evidence, indicating the Holocene Climate Optimum was about 1.2°C warmer than LIA. c. Purple curve, Earth’s axis obliquity is shown to display a similar trend to Holocene temperatures. Source: Marcott et al., 2013." "The controversial role of greenhouse gases during the Holocene What role, if any, have greenhouse gases (GHG) played in Holocene climate change? Available data indicates that despite significant changes in GHG concentration in the atmosphere during the period of 10,000 to 600 yr BP, their contribution to temperature changes cannot have been important. According to Monnin et al. (2004), CO2 concentrations measured in Antarctic ice cores decreased from 267 to 258 ppm between 10,000 and 6,800 yr BP, and afterwards increased more or less linearly to 283 ppm by 600 yr BP, just prior to the LIA (figure 38). This increase of 25 ppm represents about 10% of a doubling. Consider the period from the Last Glacial Maximum (20 kyr BP) to the HCO when atmospheric CO2 increased from 70 ppm or 36% of a doubling. We can see that the Holocene CO2 increase constitutes 27% of the CO2 increase from the coldest point of the last glacial period to the warmest point of the present interglacial. Almost a third of the glacial-interglacial span cannot be considered insignificant for the increase in CO2 that took place between 6,800 and 600 yr BP. If CO2 is as potent warming agent as purported in some theories and models, one should expect some warming coming out of this CO2 increase, especially because from 5,000 yr BP it was accompanied by an increase in atmospheric CH4 concentrations (Kobashi et al., 2007; figure 38). But instead of an increase in temperatures, what we find is a progressive decrease from the HCO to the LIA driven by changes in insolation." So, how do the current models used mostly by climate alarmist actually recreate the Holocene? If they do this well, that would make accepting their prognostic value much easier, if they do it poorly it will make accepting their prognostic value nearly impossible. 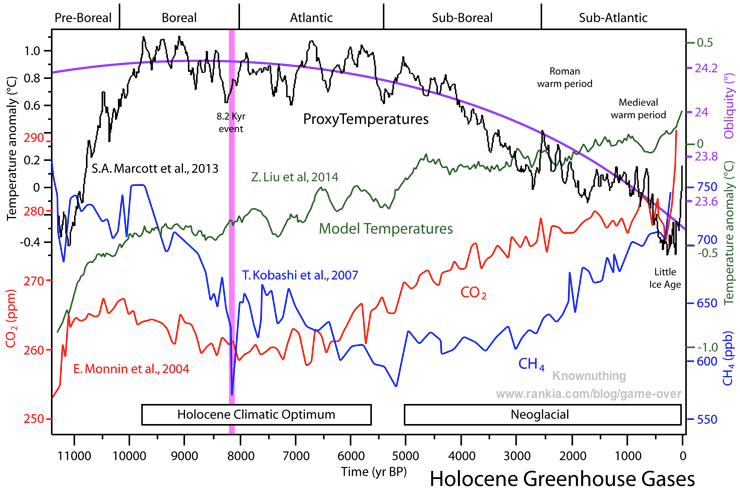 "Black curve, global temperature reconstruction by Marcott et al., 2013, as in figure 37. Purple curve, Earth’s axis obliquity cycle. Red curve, CO2 levels as measured in Epica Dome C (Antarctica) ice core, reported in Monnin et al., 2004. Blue curve, methane levels as measured in GISP2 (Greenland) ice core from Kobashi et al., 2007. Notice the great effect of the 8.2 kyr event on methane concentrations. Green curve, simulated global temperatures from an ensemble of three models (CCSM3, FAMOUS, and LOVECLIM) from Liu et al., 2014, show the inability of general climate models to replicate the Holocene general temperature downward trend. Pink bar, 8.2 kyr BP climatic event. Major Holocene climatic periods are indicated."
Ok! That makes things a bit more complicated but look only at the black line, the proxy temperature reconstruction, and the green line the average of the three climate models. They do not mirror, in fact, they are clearly opposites. The reconstruction rises first, then falls over time, while the climate models start low and slowly rise over time. This has reinforced my understanding that the climate models used by the climate alarmist are valueless, and cannot be used for any real world climate modeling. Back to the paper: "Climate models adjusted to explain present global warming do not reproduce the Holocene climate. The mean temperatures of an ensemble of three models (CCSM3, FAMOUS, and LOVECLIM; Liu et al., 2014; figure 38) show a constant increase in temperatures during the entire Holocene, driven by the increase in GHG. This disagreement between models and data-derived reconstructions of Holocene climate has been termed by the authors the Holocene temperature conundrum (Liu et al., 2014). Climate modelers should take the opportunity to adjust their models to Holocene conditions. It is clear that the main driver of Holocene climate has been changes in insolation due to orbital variation. Changes in GHG concentrations appear to have had only a minor effect." This has only reinforced my arguments made in the original article. Thanks to the author for helping me include the better proxy temperature graph, and the other very valuable materials. The prior article has a more information, charts, and graphs, I recommend it to you. Otherwise I will end with its conclusion: "You will never find the CAGW crowd arguing, or charting the period prior to 1850, at least not in the public press. All attempts to do so have ended like Michael Mann's Hockey Stick Graph in fiasco, and recriminations. The only way the crowd can win the argument when the big data set is included is through fraud, and data manipulation. They excel at this, but are incompetent at it as well. And, so, Mann was hoisted on his own petard, and made into a self-made laughingstock."
Comments
|
AuthorMaddog Categories
All
|
 RSS Feed